Sabbatical at University of Delaware (spring 2025)
Past Courses:
Kutztown University (Fall 2017 — Fall 2024):
This course is an introduction to the theory of and solutions to partial differential equations. The three big PDEs are the motivation: the heat equation, the wave equation, and Laplace’s equation. A solid understanding of linear systems of IVPs is assumed, and a strong focus on BVPs and Cauchy-Euler problems is applied initially. The theory and application of Fourier Series is motivated by finding the solutions to the three PDEs with Dirichlet and/or Neumann boundary conditions. Solutions of nonhomogeneous PDES on finite domains are considered as well as integral transforms for semi-infinite and infinite domain problems. Other topics include the method of characteristics, existence theorems, and Green’s Functions. The figure depicts the solution to the heat equation with no flux boundary conditions.
Operations Research is a classic study of mathematical optimization and its applications to a wide array of real-world problems. Operations Research uses quantitative methods to determine the best decision for an operating system. A mathematical approach to studying methods as applied to the decision process in industry is taken. The methods studied are selected from among: linear programming, game theory, graph theory and network analysis. Our focus in this course will be on linear programming and sensitivity analysis. Students will be required to use appropriate computer software, including Excel. The figure depicts the optimal solution to a two-dimensional linear programming problem. The planar surface shows the objective function reaching it’s maximum value at a corner point of the feasible space.
An introduction to the theory of ordinary differential equations and their applications. Topics include analytical and qualitative methods for analyzing first-order differential equations, second-order differential equations, and systems of differential equations with an emphasis on modeling predator-prey and competing species systems. Analytical methods for finding solutions to differential equations will range from separation of variables and variation of parameters to Laplace transforms. Special emphasis will be placed on equilibria, stability analysis, and phase portraits of both linear and nonlinear equations and systems. The figure shows the phase-portrait with several trajectories of a nonlinear system that undergoes a subcritical Hopf bifurcation.
This course is one of a series intended for students who major in mathematics, the sciences, or engineering. The topics include the definition and calculation of limits, continuity and differentiability, differentials, derivatives of algebraic and transcendental functions, the application of derivatives to graphing, antiderivatives, and the introduction of the definite integral, applications of definite integrals; and some techniques of integration. The figure above shows a midpoint Riemann sum approximation to the area under the curve y = x(x-1)(x+3).
This course is an introduction to quantitative methods as applied to statistical reporting and data analysis. It incorporates some or all of the following: Techniques for obtaining, analyzing and presenting data in numerical form; measures of central tendency and dispersion; the normal distribution curve; standard scores; applicability of probability and sampling theory to statistical research; interpretation of confidence intervals; hypothesis testing; correlation; linear regression. The figure to the left gives a simple population distribution and the corresponding sampling distribution of sample means from samples of size 15.
This course is designed to give students a thorough review of the mathematics background needed for calculus courses. Topics generally include properties of the real numbers, problem-solving using equations and inequalities, algebraic functions, graphing, and systems of equations. A treatment of trigonometry is also provided as well as applications of exponential functions. The figure shows trajectories of different exponential functions. Each function produces the amount of money at time t in an account if yearly interest is compounded n times throughout the year. The black curve shows the limit as n -> infinity, which indicates that interest is compounded continuously.
This course is intended for students with an elementary knowledge of algebra who need more work in trigonometric topics before taking more advanced mathematics courses. Topics include properties of and operations of functions, inverse functions, exponential and logarithmic functions, angle measurement, trigonometric functions and their inverses, graphing functions, and problem solving with equations. The figure shows the graph of the cosine function for increasing amplitude and increasing frequency given by f(x) = kcos(kx/2pi), for k ranging from -15 to 15.
Trinity College (Fall 2014 — Spring 2017):
This course is an upper level math class focusing on discrete and continuous probability, combinatorial analysis, random variables, random vectors, density and distribution functions, moment generating functions, and particular probability distributions including the binomial, hyper-geometric, gamma, and normal. The weak and strong law of large numbers is discussed and the proof of the Central Limit Theorem is covered. The figure to the left illustrates the Central Limit Theorem.
This course is designed as a companion course to MATH 252, with an alternate set of topics that emphasize mathematical applications from the social sciences, especially economics. In this course, we analyze and simulate discrete, continuous, and stochastic models that relate to economics and finance. Basic fixed/equilibrium point analyses are covered for single equations and systems. An emphasis on numerical simulation is also covered using MATLAB. The figure to the left shows a bivariate histogram for two best fit parameters of a continuous Allee-Effect model.
An introduction to the theory of ordinary differential equations and their applications. Topics include analytical and qualitative methods for analyzing first-order differential equations, second-order differential equations, and systems of differential equations. Analytical methods for finding solutions to differential equations will range from separation of variables and variation of parameters to Laplace transforms. Special emphasis will be placed on equilibria, stability analysis, and phase portraits of both linear and nonlinear equations and systems. The movie to the left shows a bifurcation of a one-parameter family of first-order linear systems.
A typical multivariate calculus course covering vector-valued functions; partial derivatives; double and triple integrals; line and surface integrals of scalar functions and vector fields; polar, cylindrical, and spherical coordinate systems; and Green's Theorem, Stokes' Theorem, and the Divergence Theorem. The figure to the left shows the contour plot of a smooth surface with the gradient vector field overlaid. This shows how the gradient is perpendicular to level curves of the surface.
MATH 228 is a proof-based course in linear algebra, covering systems of linear equations, matrices, determinants, finite dimensional vector spaces, and linear transformations. The least-squares problem and eigenvalues/eigenvectors are typically covered towards the end of the class. Although there is a computational component to the class, a stronger focus is put on developing well written proofs, which may include the properties of matrix algebra, set containment, linear independence, and properties of vector spaces and subspaces. The figure to the left shows the intersection of three planes in three dimensional space, i.e. a 3x3 linear system with a unique solution.
This course is a computational workshop designed to introduce the student to Matlab, a powerful scientific computing software package. The workshop will focus on visual learning based on graphical displays of scientific data and simulation results from a variety of mathematical subject areas, such as calculus, differential equations, statistics, linear algebra, and numerical analysis. No prior computer language skills are required as basic programming tools such as loops, conditional operators, and debugging techniques will be developed as needed. The workshop prepares the student for future courses in applied mathematics as well as courses in other disciplines where scientific computing is essential. The figure to the left is a fractal map called the Julia set generated by Matlab with additional lighting/smoothing features enabled. Figure credit goes to Mariam Avagyan.
This class is an introductory course to modern statistical techniques that moves more quickly than its MATH 107 counterpart. Techniques of data analysis are explored including graphical methods, random variables, discrete and continuous probability models, regression analysis, sampling distributions for sample proportions and means, and inference for one and two population proportions and means. The figure to the left shows the binomial probability distribution.
A typical calculus II course for students in the natural sciences that focuses primarily on the Riemann integral and its applications, techniques of integration, first-order ordinary differential equations, and infinite sequences and series. The figure to the left shows the infinite area under a discontinuous function.
This course is a typical first calculus class designed for mathematics, natural science, and computer science majors. The course introduces important functions and graphs, the concept of limits and continuity, derivatives and their applications, and anti-derivatives with a brief introduction to the fundamental theorem of calculus. The figure to the left demonstrates Newton's Method for approximating roots of functions.
This course is a light introduction to statistical methods primarily for students in the social and natural sciences. The course typically covers the general measures of central tendency and dispersion, graphical displays of categorical and quantitative data, basic probability, random variables, sampling distributions, and inference for one and two population means. The figure to the left demonstrates the law of large numbers by keeping track of the proportion of heads that are flipped over a trial of 100 coin flips.
UNIVERSITY OF DELAWARE (Fall 2010 — Spring 2013, Summer 2017):
MATH 117 -- Pre-Calculus
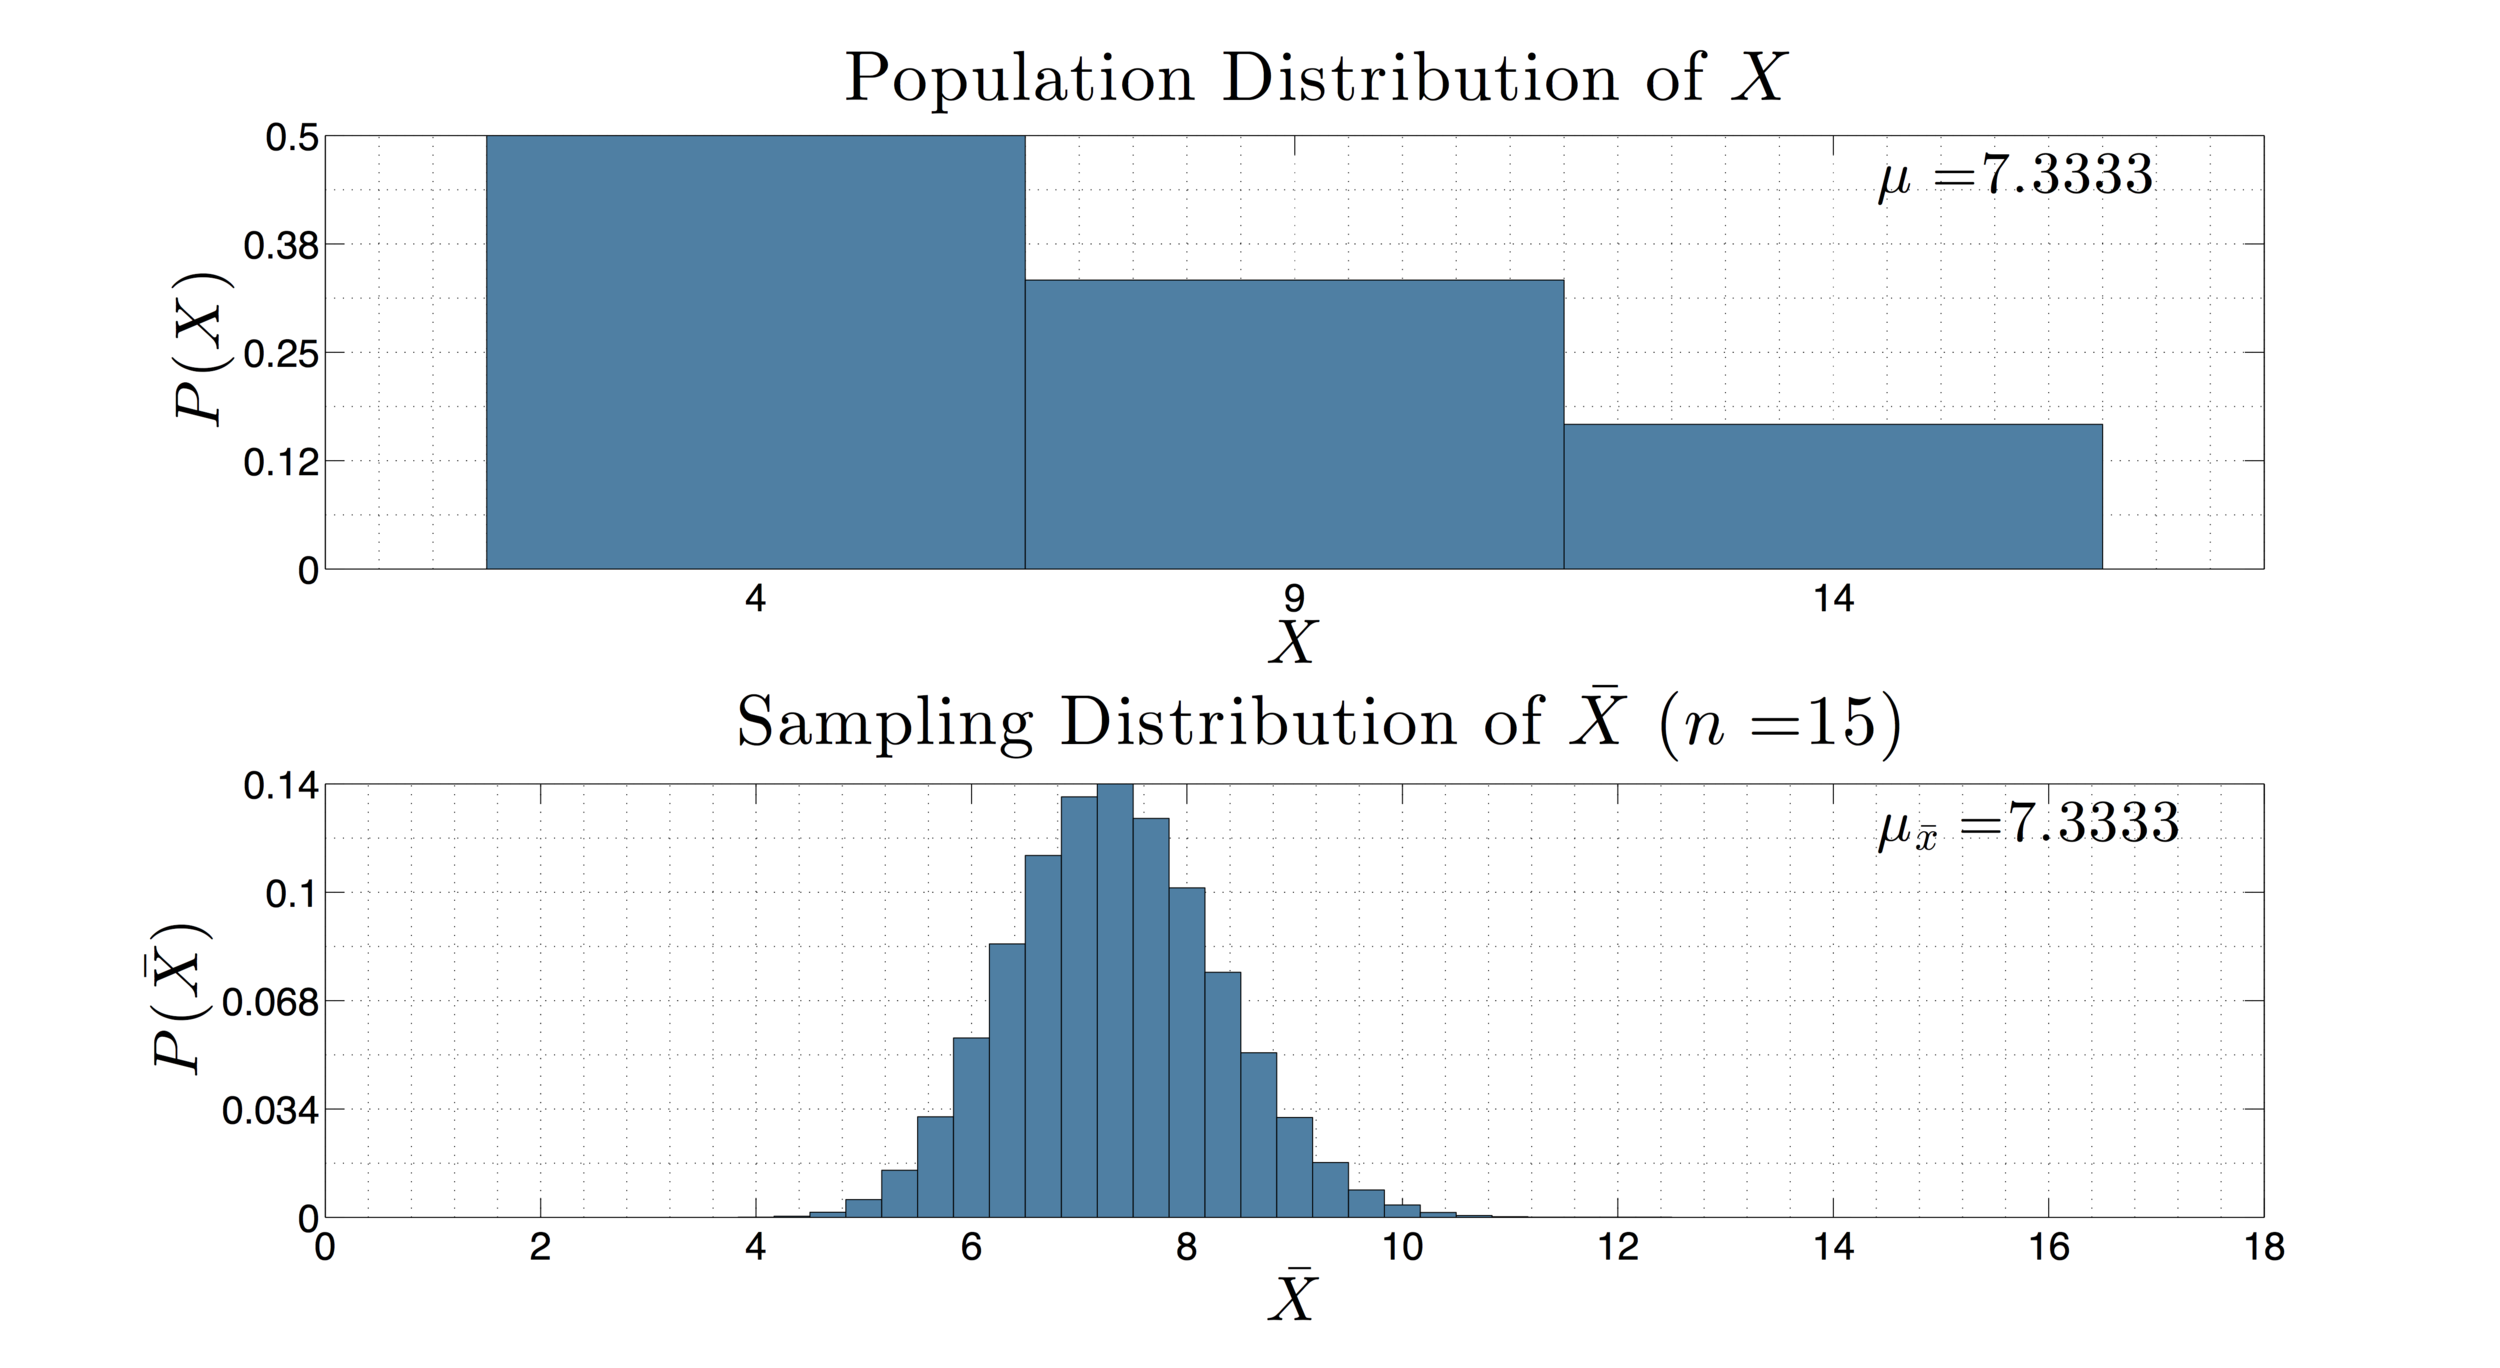
MATH 210 -- Statistics for Business and Economics
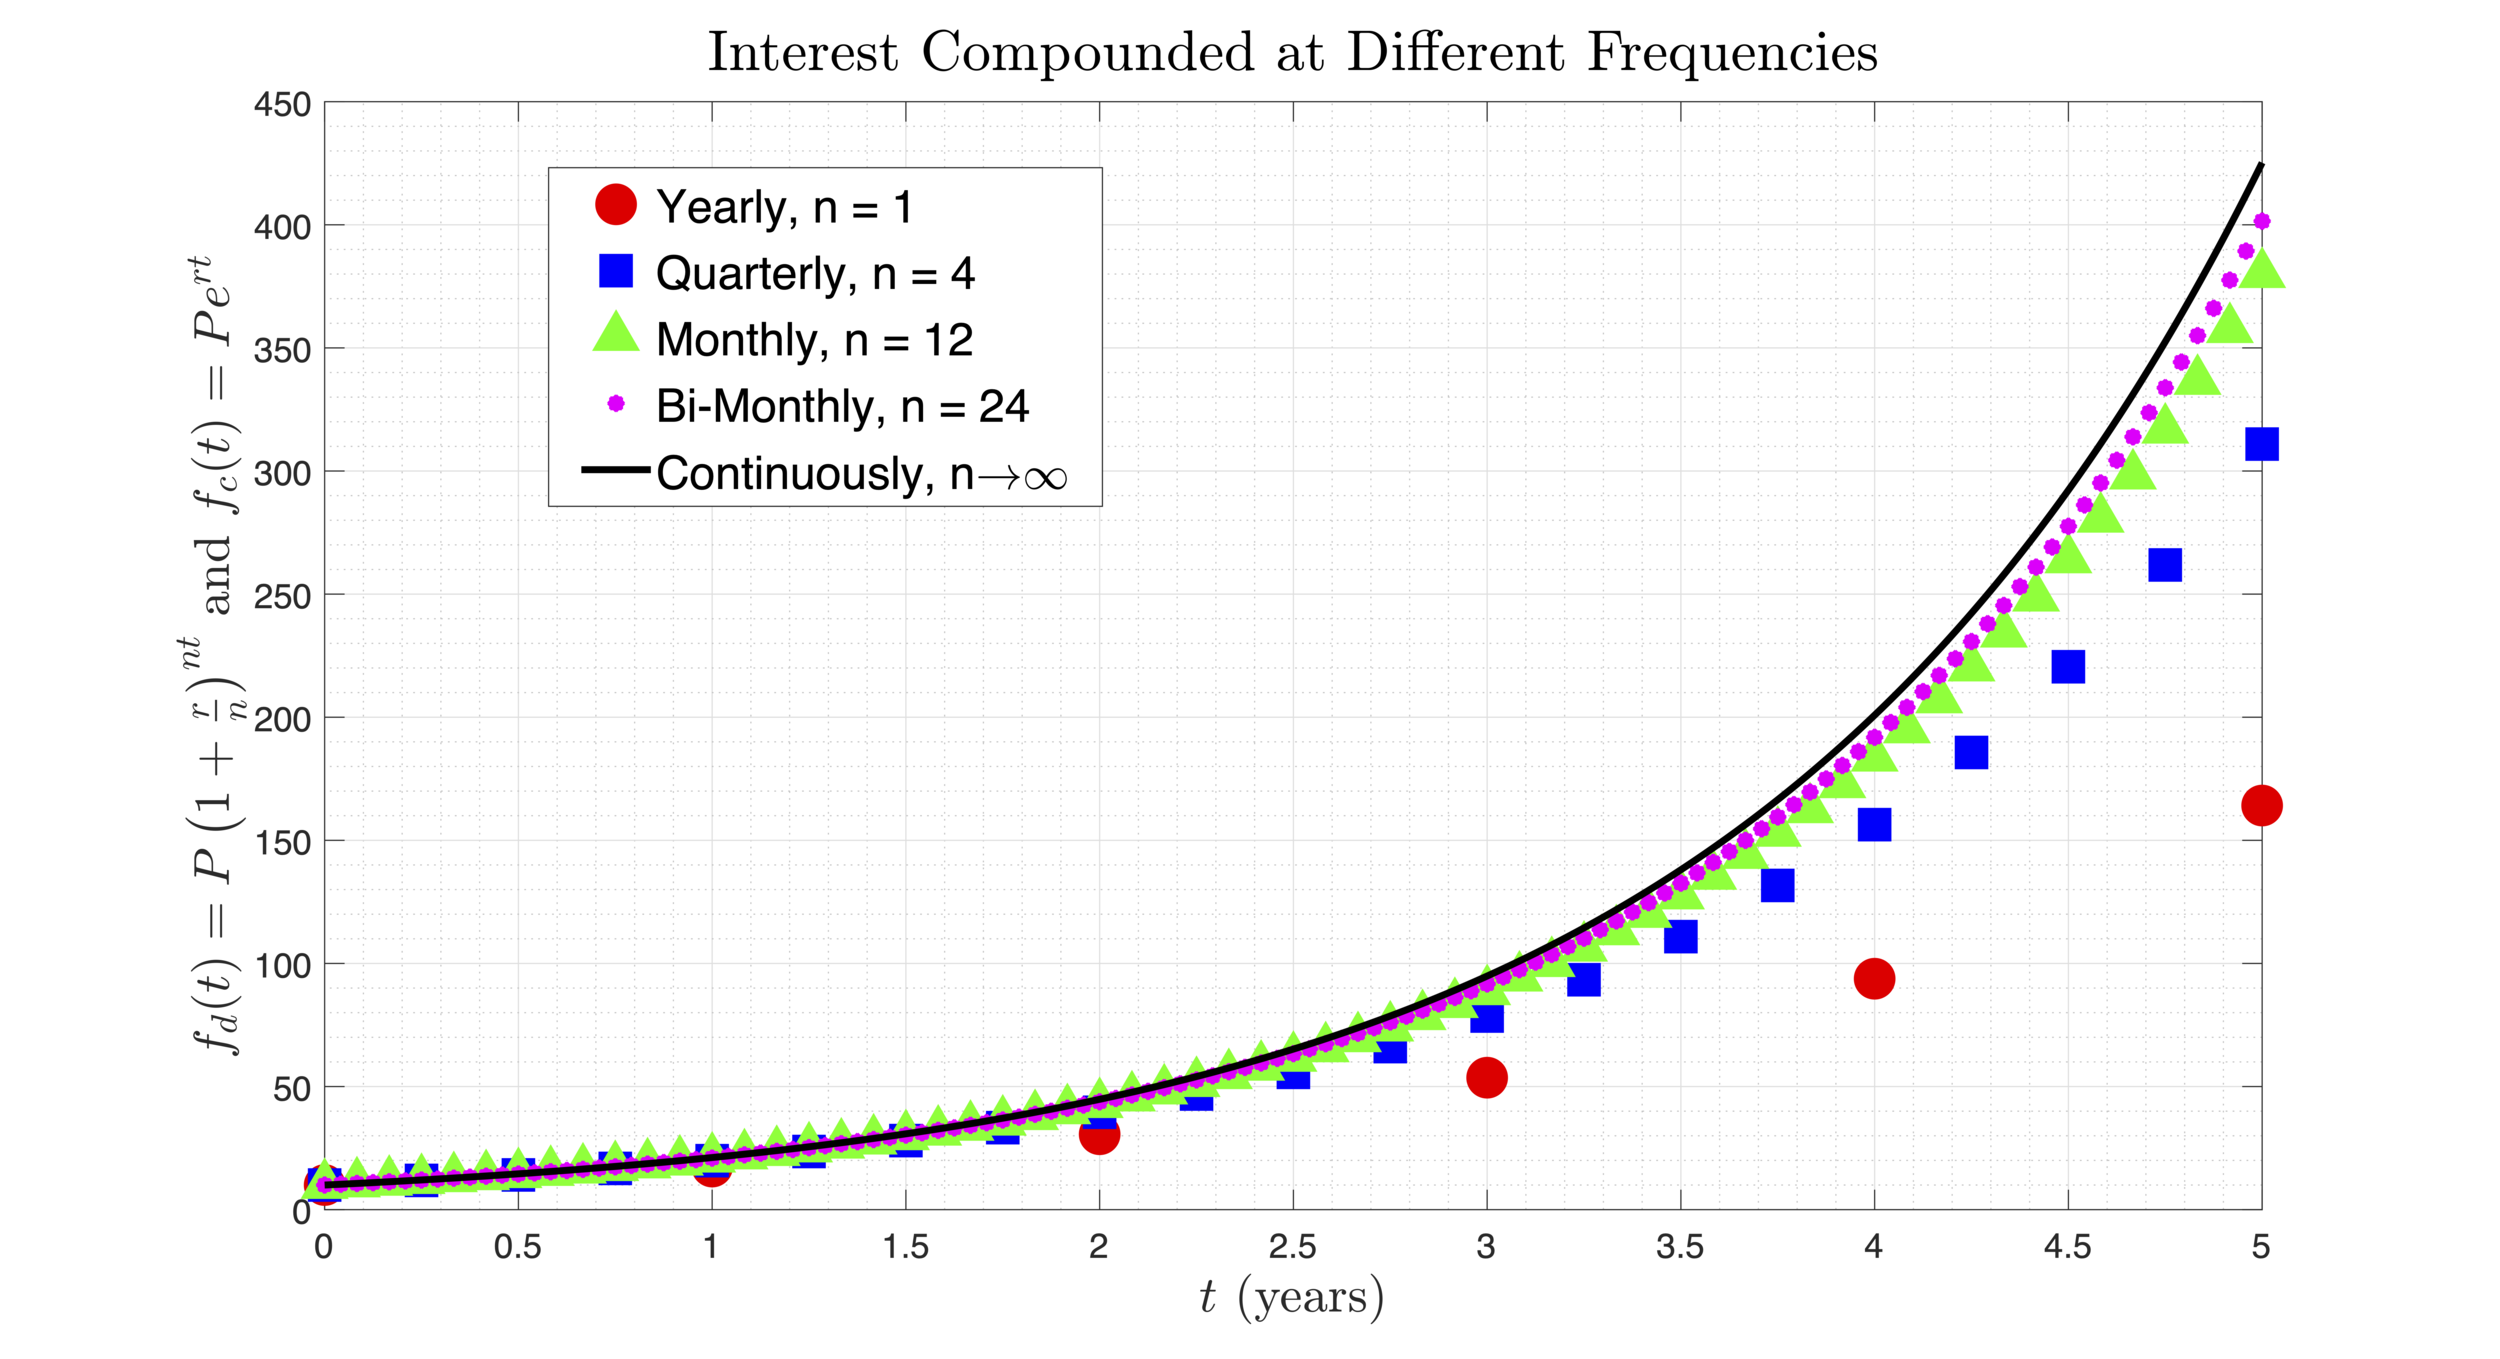
MATH 221 -- Business Calculus
MATH 241 -- Calculus I
MATH 242 -- Calculus II with Maple Lab
MATH 243 -- Calculus III
This course is one of a series intended for students who major in mathematics, the sciences, or engineering. The topics include the definition, properties, and applications of definite integrals; properties, derivatives, and integrals of exponential, logarithmic, trigonometric, inverse trigonometric, and hyperbolic functions with applications; techniques of integration; indeterminate forms and improper integrals; sequences, series, and convergence tests; differentiation and integration of power series; and polar integrals. This figure shows the function f(x) = cos(x) along with several approximating Taylor polynomials centered at a = pi/3. We can see that as the degree of the polynomial gets larger, the Taylor polynomials converge to the function.