1
2
MAT 140 -- Applied Statistical Methods
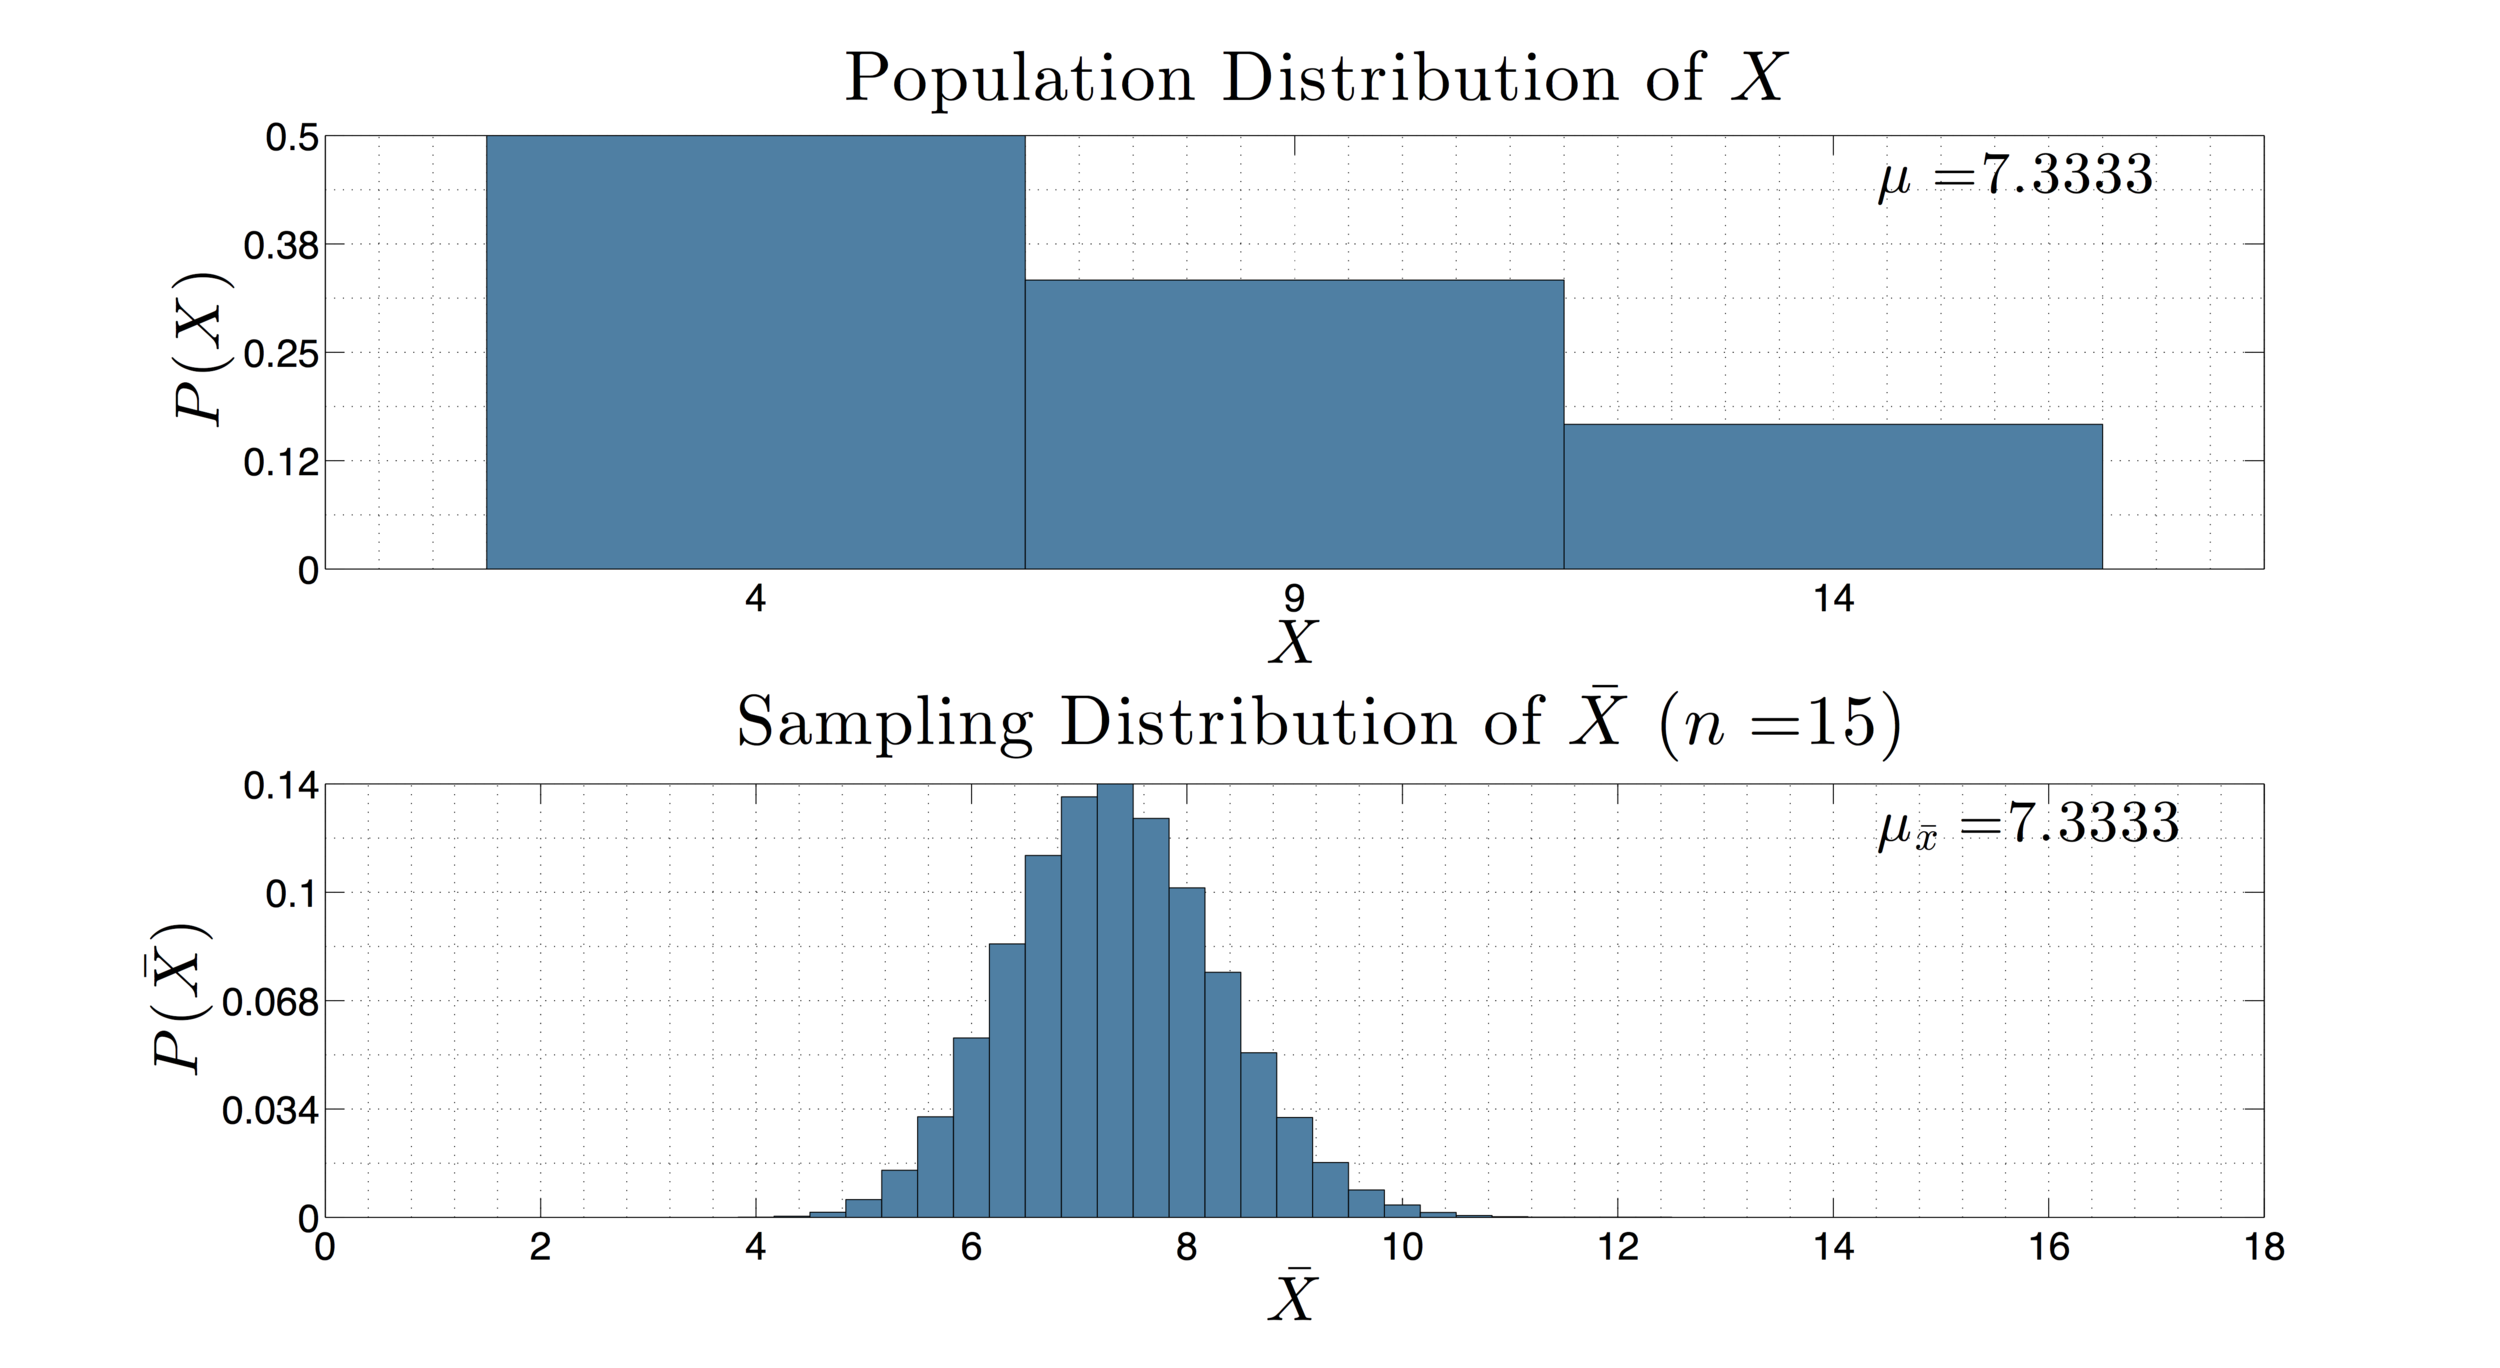
This course is an introduction to quantitative methods as applied to statistical reporting and data analysis. It incorporates some or all of the following: Techniques for obtaining, analyzing and presenting data in numerical form; measures of central tendency and dispersion; the normal distribution curve; standard scores; applicability of probability and sampling theory to statistical research; interpretation of confidence intervals; hypothesis testing; correlation; linear regression. The figure to the left gives a simple population distribution and the corresponding sampling distribution of sample means from samples of size 15.
MAT 115 -- Precalculus
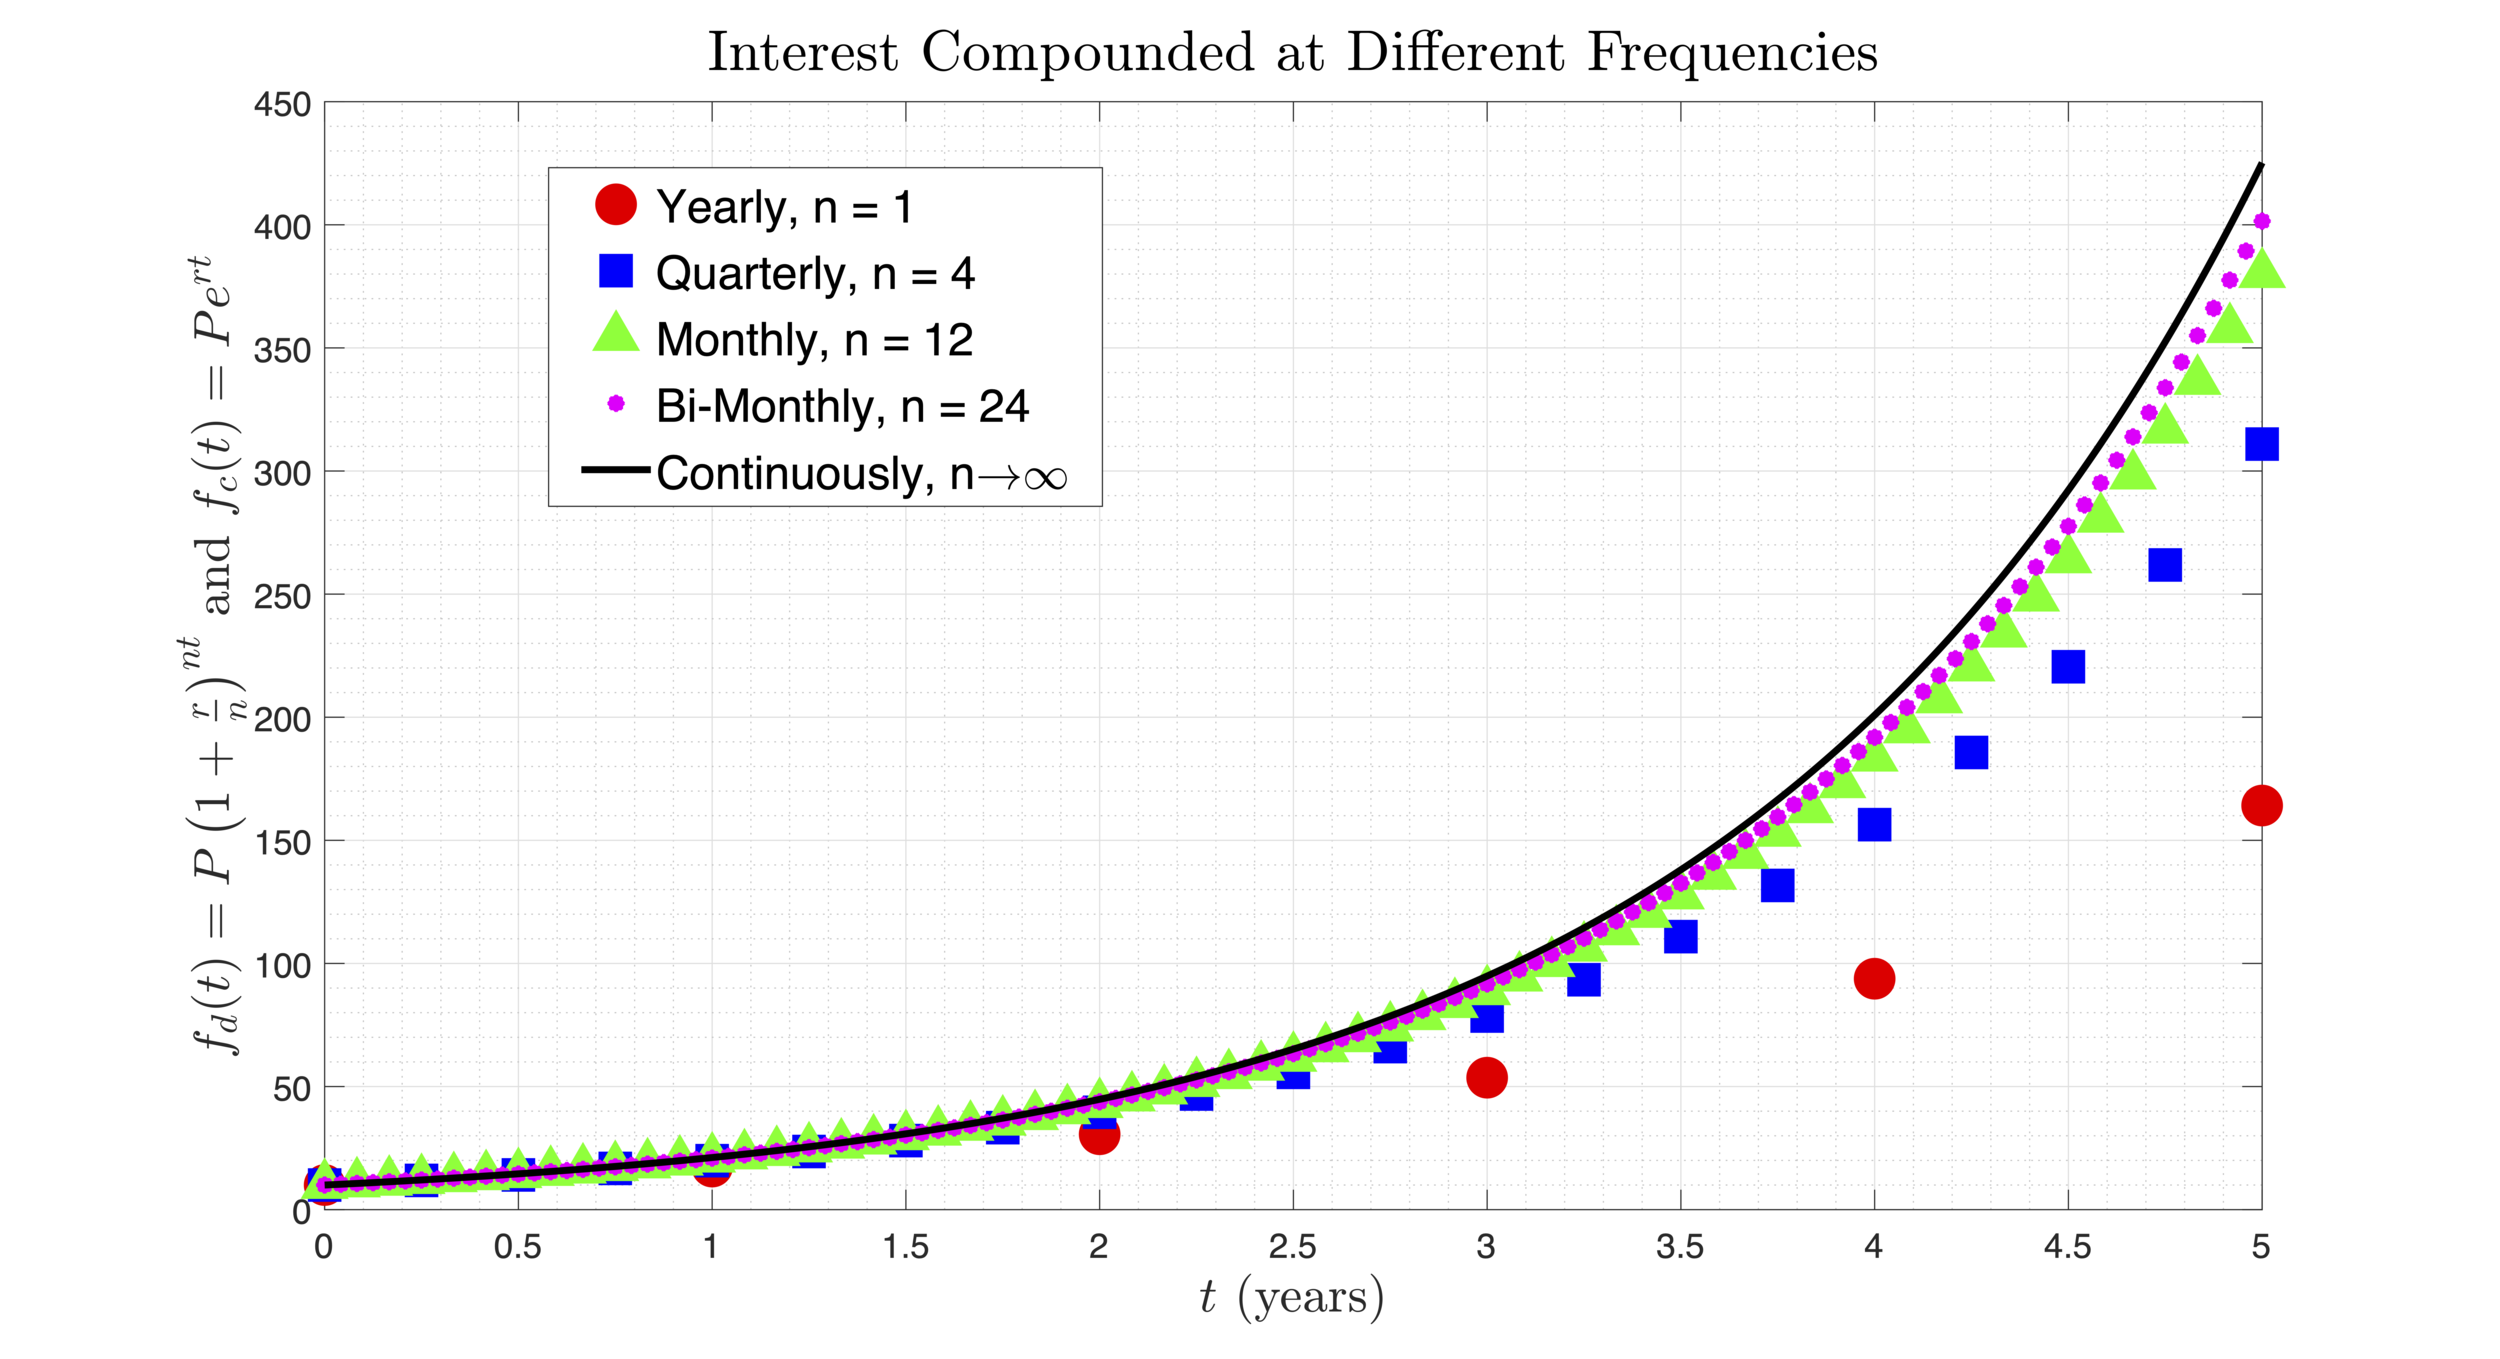
This course is designed to give students a thorough review of the mathematics background needed for calculus courses. Topics generally include properties of the real numbers, problem-solving using equations and inequalities, algebraic functions, graphing, and systems of equations. A treatment of trigonometry is also provided as well as applications of exponential functions. The figure shows trajectories of different exponential functions. Each function produces the amount of money at time t in an account if yearly interest is compounded n times throughout the year. The black curve shows the limit as n -> infinity, which indicates that interest is compounded continuously.